That script changed in 2017, when the NHL added the Las Vegas Golden Knights. The Knights, thanks to a combination of more lax team-building guidelines and the ability to rally a community behind sports after a tragic incident, went on a tear, setting first-year records for wins and points, and they became the first expansion team in the four North American sports to win their division. Their success carried over to the playoffs, where they were the first first-year team in 50 years to reach the Stanley Cup Finals, losing to the Washington Capitals in 6 games. Despite capturing the hearts and minds of hockey and sports fans everyone, the Golden Knights are still considered a bit of a unicorn.
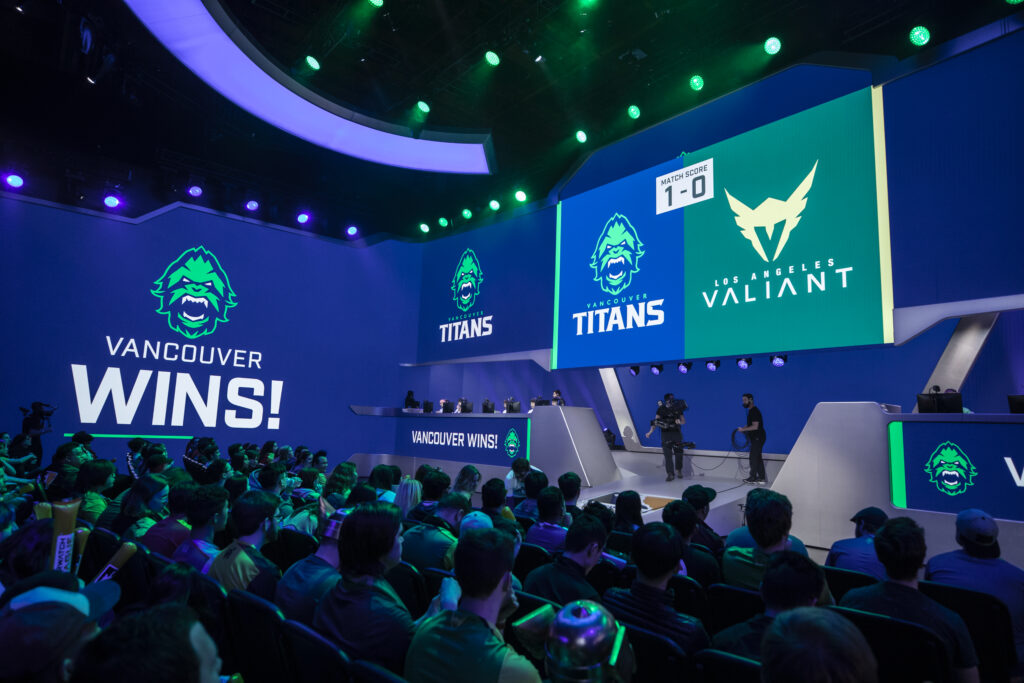
Until we start talking about the Vancouver Titans.
We must start with the caveat that the Titans are not built like a traditional expansion team. They were effectively fully formed in the Overwatch Contenders League and were just ported over during Overwatch’s expansion to 20 teams, so this is much more like a promoted team in soccer than an expansion team in American sports, but even a good promoted side is rare. That being said, it’s much easier to compare (primarily) North American sports because we can use our favorite metric: Expected Wins.
Kyle Gipe over at The Hockey Writers did most of the heavy lifting for me on the hockey side, and his article has a nice recap of how Expected Wins works, so you can catch up on how the formulae are derived. I’m still using my Overwatch Formula I explained in my article about the Shanghai Dragons and refined for my article on the Valiant.
So, on the eve of Vancouver’s first Stage 2, here’s how things shake down between the two franchises in their first quarter-seasons
Overwatch Night In Canada
Expected Win % based on maps/goals lost, first quarter-seasons¹
| Team/Season | PF | PA | Exp Win % |
| Las Vegas ’17-18 | 72 | 60 | 0.601 |
| Vancouver 2019 | 24 | 6 | 0.925 |
¹-First 20 games for Las Vegas, Vancouver record does not include stage playoffs
On the individual match level, Vancouver would be expected to win 93% of their matches based on a map won-loss percentage of 80%. The Golden Knights outscored their opponents by about 0.6 goals per game, leading to an expected match win rate of only about 60%, which over a full season, would be near the league’s best (Winnipeg had 63% over the full season) but nowhere near the dominance of the Titans.
Better Good Than Lucky
Expected Win % vs Actual Wins, first quarter-season
| Team/Season | Exp W% | GP | Exp W | Act W | Diff | % of Exp W |
| Las Vegas ’17-’18 | 0.601 | 20 | 12.02 | 13 | 0.98 | 8.16% |
| Vancouver 2019 | 0.925 | 7 | 6.47 | 7 | 0.53 | 8.13% |
Having a good record usually means a few extra things go your way, but neither last year’s Knights nor this year’s Titans were particularly luckier than the other. Vegas’ 13 wins over 20 games was only 8.1% more than the 12 one would expect at their Pythagorean win rate. Same with Vancouver. For comparison, the Paris Eternal, the most overachieving team of Stage 1, won 3 games vs. an expectation of 1.8. In other words, Paris won 67% more than expectation (but still couldn’t make Stage Playoffs).
Of course, it’s not the regular season that defined the Golden Knights, it was the playoffs, so let’s do that head-to-head as well.
Playoffs?! Playoffs???
Expected Win % in Playoff Matches
| Team/Season | PF | PA | Exp % | Chg vs Reg. |
| Las Vegas ’17-’18 | 57 | 47 | 0.607 | +0.006 |
| Vancouver 2019 | 11 | 3 | 0.913 | -0.012 |
Both Vegas and Vancouver went about the same in the playoffs as the regular season, but the higher level of competition got the better of Vegas in their season championship. That could’ve easily have been Vancouver in the Stage 1 final, but an record-fast final map got the Titans over the hump. The Overwatch Season 2 playoffs are still 5 months away. Being undefeated puts Vancouver in a good spot, and based on the tree diagram, they have a 29% of going undefeated in all four stages, but true immortality will have to wait.

