Many things can matter in sports, but few matter more than championships, and what matters to the Overwatch League’s London Spitfire is that they won the inaugural championship, beating the Philadelphia Fusion in what looked like a walkover. The story of the Spitfire’s season seems straightforward: after winning the first of OWL’s four stages and finishing strong in the second, London went a pedestrian 9-11, finishing tied for fifth in a league where only 6 teams make the playoffs. However, once the regular season ended they demolished their opponents, dropping only 5 of the 24 maps they competed in, and finished playing literally their best Overwatch of the season.
Catching Spitfire
London’s Pythagorean Wins by Stage
| Stage | Maps Won |
Maps Lost |
Maps Tied |
Map Win% |
Exp. Map W% |
Wins per 40 gms | Exp. Wins/40 |
Result |
| Stage 1 | 35 | 17 | 0 | 0.673 | 0.770 | 30.00 | 30.78 | Winner |
| Stage 2 | 33 | 14 | 0 | 0.702 | 0.807 | 29.09 | 32.29 | L Semis |
| Stage 3 | 24 | 21 | 1 | 0.533 | 0.554 | 20.00 | 22.17 | T-6th |
| Stage 4 | 18 | 23 | 2 | 0.442 | 0.404 | 16.00 | 16.15 | T-8th |
| Finals | 18 | 5 | 1 | 0.771 | 0.883 | 34.29 | 35.34 | Champions |
NOTE: Stages include playoffs when applicable
I had mentioned Pythagorean Wins in a previous post, which was a measure of how many matches we expect a team to win based on how many maps they won. In that article, I had mentioned that London under-performed its expectation in regular season matches. Technically, they also under-performed in the finals, but nowhere near to the degree they did earlier in the season.
Not only were the playoffs the best London had performed over a long stretch of time, their expected wins per 40 matches (the length of OWL’s regular season in 2018, btw) was actually one of the top performances of the year.
No Mr. Bond, I Expect You To Win
Best OWL Performances by Expected Wins
| Team | Stage | Maps Won |
Maps Lost |
Maps Tied |
Map Win% |
Exp Win% |
EW/40 | Stage Result |
| NY XL | 3 | 39 | 11 | 1 | 0.775 | 0.887 | 35.48 | Winner |
| NY XL | 2 | 37 | 11 | 0 | 0.771 | 0.883 | 35.34 | Winner |
| London | Finals | 18 | 5 | 1 | 0.771 | 0.883 | 35.34 | Champion |
| NY XL | 1 | 33 | 13 | 2 | 0.708 | 0.815 | 32.59 | L Final |
| London | 2 | 33 | 14 | 0 | 0.702 | 0.807 | 32.29 | L Semi |
| LA Glad | 4 | 32 | 14 | 1 | 0.691 | 0.794 | 31.75 | L Semi |
| Boston | 3 | 34 | 16 | 2 | 0.673 | 0.770 | 30.78 | L Final |
| LA Val | 4 | 34 | 16 | 2 | 0.673 | 0.770 | 30.78 | Winner |
| London | 1 | 35 | 17 | 0 | 0.673 | 0.770 | 30.78 | Winner |
| Houston | 1 | 31 | 16 | 0 | 0.660 | 0.751 | 30.04 | L Semi |
NOTE: Stages include playoffs when applicable
In the four stages and finals, there were ten instances of teams playing at a 30-win or higher pace. London had three of those, which definitely solidifies their claim to be a rightful champion, but the New York Excelsior had three of the top four and while those performance padded their wallets to the tune of $225,000 (plus an extra $300k for having the best regular season record), all they got in the end was a sweep by Philadelphia who won $400,000 just by making the grand final. (New York did get $100,000 for their Semifinal loss.)
If it’s starting to sound like the playoff results make the regular season feel insignificant, well, welcome to sports. It also doesn’t help that despite all the questions surrounding London’s performance, their entry into the playoffs was rarely in doubt.

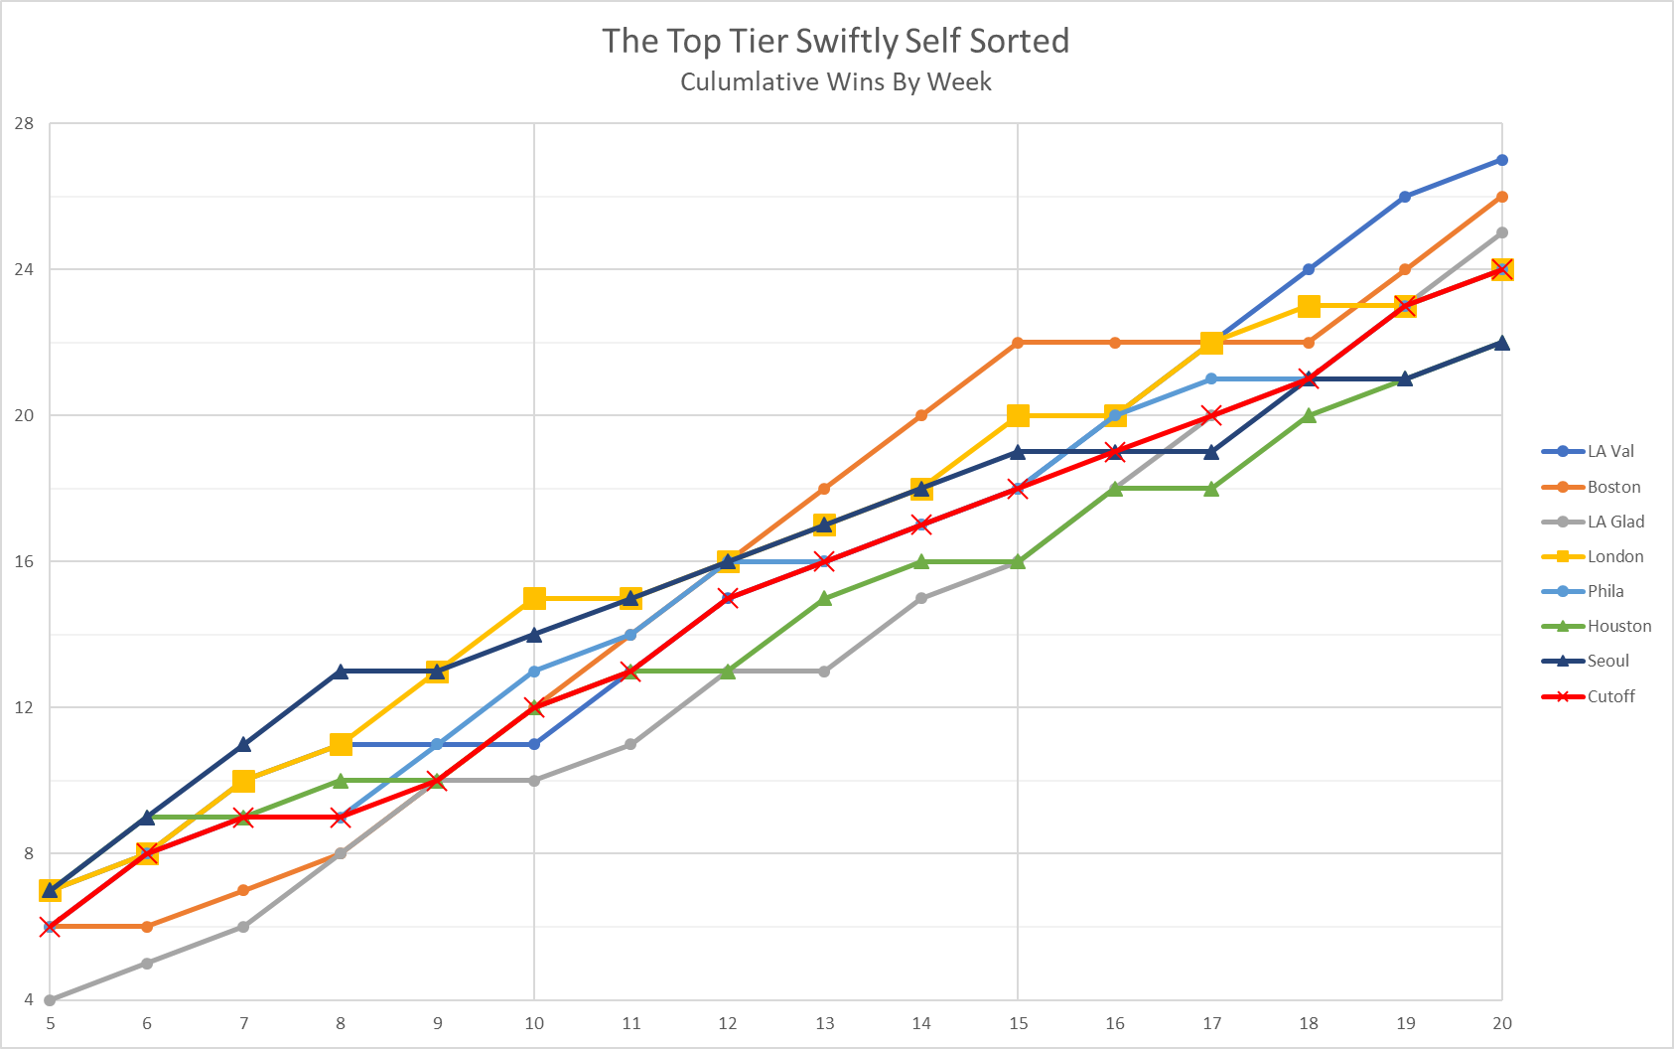
The above chart shows the win totals for the teams rank 2nd through 8th in the final OWL standings as well as the red cutoff line for where 6th place would have been for that week. London, represented by the gold line with squares, only fell to the cutoff line in the penultimate week of the season, when they had a two-game lead over the Houston Outlaws and the Seoul Dynasty with two games remaining and had clinched the first tiebreaker (map differential). In other words, they clinched a playoff spot in a week where they won zero matches.
Of course, this is sort of the point of having a long regular season. By the time the playoffs roll around, there should be no doubt who the best teams are. The problem is that the playoffs are short enough to let randomness kick in. Viewed head-to-head¹ New York had a 73% chance of beating Philadelphia and only a 9% chance of losing in a sweep, but Philly swept them. London only had a 59% of beating Philadelphia, yet the Spitfire looked like they were the NYXL all along.
So when looking ahead to Season 2, feel free to remain invested, but invest just long enough to figure out who you’re going to back in the playoffs.
¹-Each team’s expected winning percentage was normalized so that the sum of the two equaled 1. Those numbers were plugged into the binomial distribution for each potential best-of-5 game outcome. Those results went through the same process to get best-of-3 match outcomes.

